I was told multiple times that infrastructure should be “upgraded frequently so that upgrading gets easier and easier”, and that’s what my colleagues did. They decided to bump the Meteor version after staying on a very old version for a long time. It did not go well.
The building gets super slow, people seem not to notice slower dev building because it’s always been slow without cache, which can take 2 hours, and almost always exceeds node memory limit. The not noticing part is funny, but what’s funnier is the root cause. The path of me finding it is longer than it should be. I think it’s more interesting that nothing stops these tools and methods to be automated, yet both Babel and Meteor don’t care enough to do that.
- The tldr version is WeakMap with > 2 million keys is slow
- The tldr lesson is Babel and Meteor do not run performance regression test
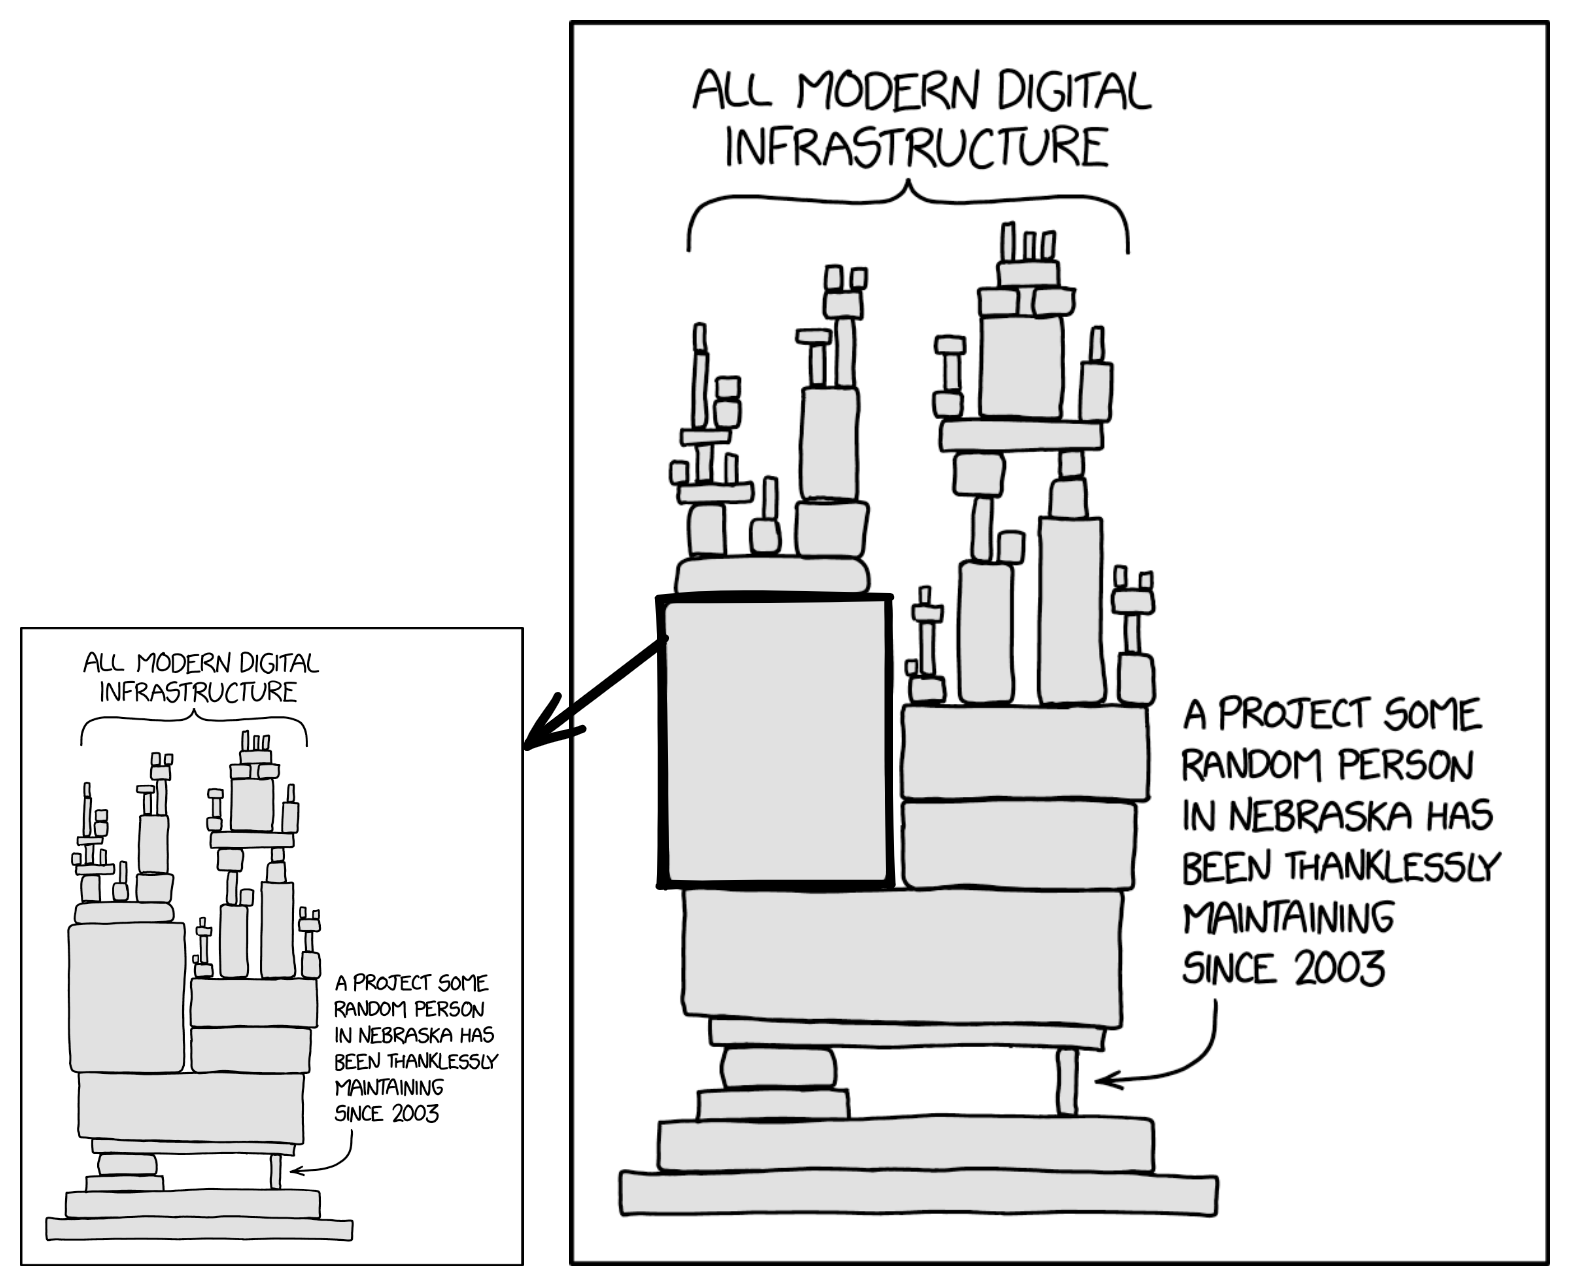
- Another tldr lesson is, illustrated in the following revised xkcd, the dependency flaw is recursive
Slow Meteor building
Any developer that has upgraded libraries or frameworks probably won’t be surprised when they hit a major performance downgrade. That’s why “not upgrading unless one has to” is believed to be a best practice before the above claim of upgrading frequently, for good reasons. So that’s what you get, build times increased significantly since upgrade to 2.5.6, ‘significantly’ is really orders of magnitude.
Babel.compile..........................................603,897 ms (25639)
linker File#computeAssignedVariables...................488,136 ms (27564)
other ImportScanner#findImportedModuleIdentifiers.......43,497 ms (26261)
It’s not hard to infer what does that mean for the dev pipelines. The building is such an universal bottleneck that these pipelines get meaningless because any node in the sequential jobs can timeout and break the flow.
Babel parser
Surprisingly, it’s not hard to figure out the slow steps, thanks to Meteor’s profiling. I was first mislead by the above thread that mentioned the cache for parser result might need a resize because statiscally the order of package files get processed (linked in Meteor’s context) might change. As always, the truth simpler than what it appears to be. The parser, of two particular version, has a major performance hit. What’s more interesting is the hit only happens when WeakMap has more than about two millions keys, which is very common for that use case in the parser.
what happens next is tedius, I ended up just replacing parser code tools/node_modules/@babel/parser/lib/index.js with that of an older version and fast build is back.
Dive Deeper
The performance test written by the Babel team turns out to be quite revealing, which is also ironic that it’s one tiny step away from being automated.
┌──────────────────────────┬────────────────────────────────┬──────────────────────────────┐
│ fixture                  │ babel_parser_7.16.12           │ babel_parser_7.17.12         │
├──────────────────────────┼────────────────────────────────┼──────────────────────────────┤
│ es5/angular.js           │ 10.29 ops/sec ±22.89% (97ms)   │ 70.5 ops/sec ±10.83% (14ms)  │
├──────────────────────────┼────────────────────────────────┼──────────────────────────────┤
│ es5/ember.debug.js       │ 1.28 ops/sec ±134.41% (779ms)  │ 25.55 ops/sec ±6.51% (39ms)  │
├──────────────────────────┼────────────────────────────────┼──────────────────────────────┤
│ es5/babylon-dist.js      │ 2.35 ops/sec ±129.79% (426ms)  │ 122 ops/sec ±3.96% (8.193ms) │
├──────────────────────────┼────────────────────────────────┼──────────────────────────────┤
│ es5/jquery.js            │ 2.98 ops/sec ±102.73% (335ms)  │ 146 ops/sec ±8.2% (6.864ms)  │
├──────────────────────────┼────────────────────────────────┼──────────────────────────────┤
│ es5/backbone.js          │ 16.61 ops/sec ±96.49% (60ms)   │ 703 ops/sec ±1.46% (1.422ms) │
├──────────────────────────┼────────────────────────────────┼──────────────────────────────┤
│ es5/react-with-addons.js │ 1.75 ops/sec ±138.36% (572ms)  │ 73.69 ops/sec ±2.3% (14ms)   │
├──────────────────────────┼────────────────────────────────┼──────────────────────────────┤
│ es6/angular-compiler.js  │ 0.52 ops/sec ±158.51% (1921ms) │ 35.22 ops/sec ±12.04% (28ms) │
├──────────────────────────┼────────────────────────────────┼──────────────────────────────┤
│ es6/material-ui-core.js  │ 1.05 ops/sec ±173.55% (956ms)  │ 43.82 ops/sec ±7.19% (23ms)  │
└──────────────────────────┴────────────────────────────────┴──────────────────────────────┘
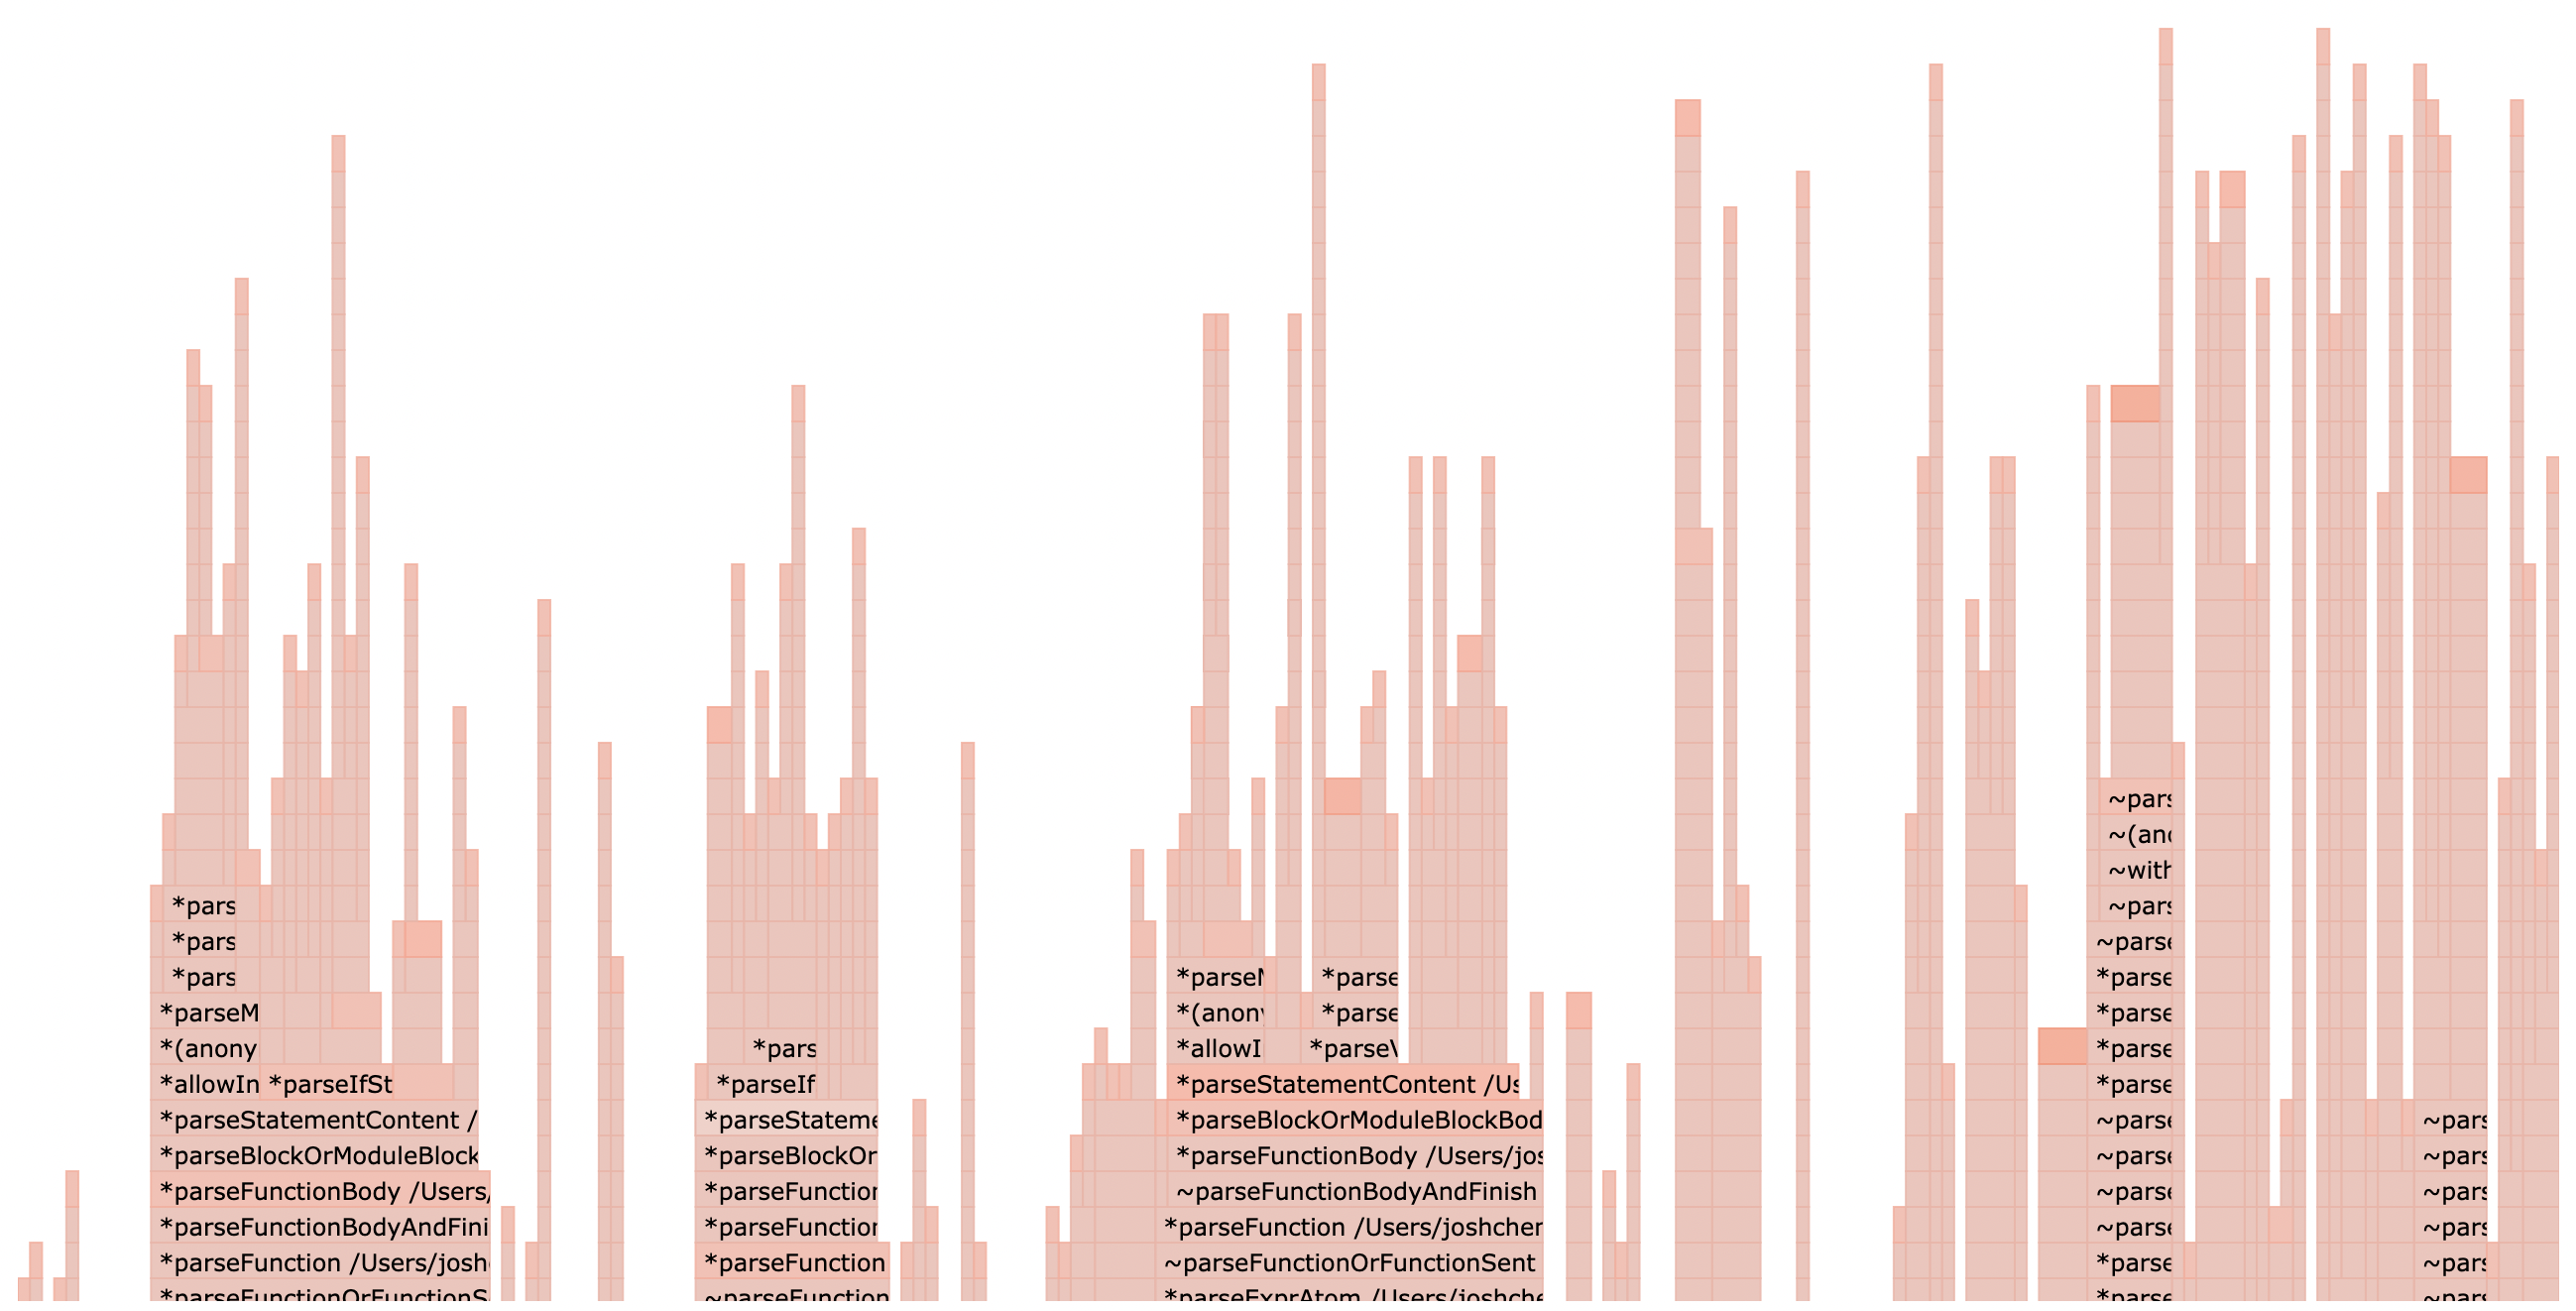
Another general way to dig out root cause of performance hit is flame chart
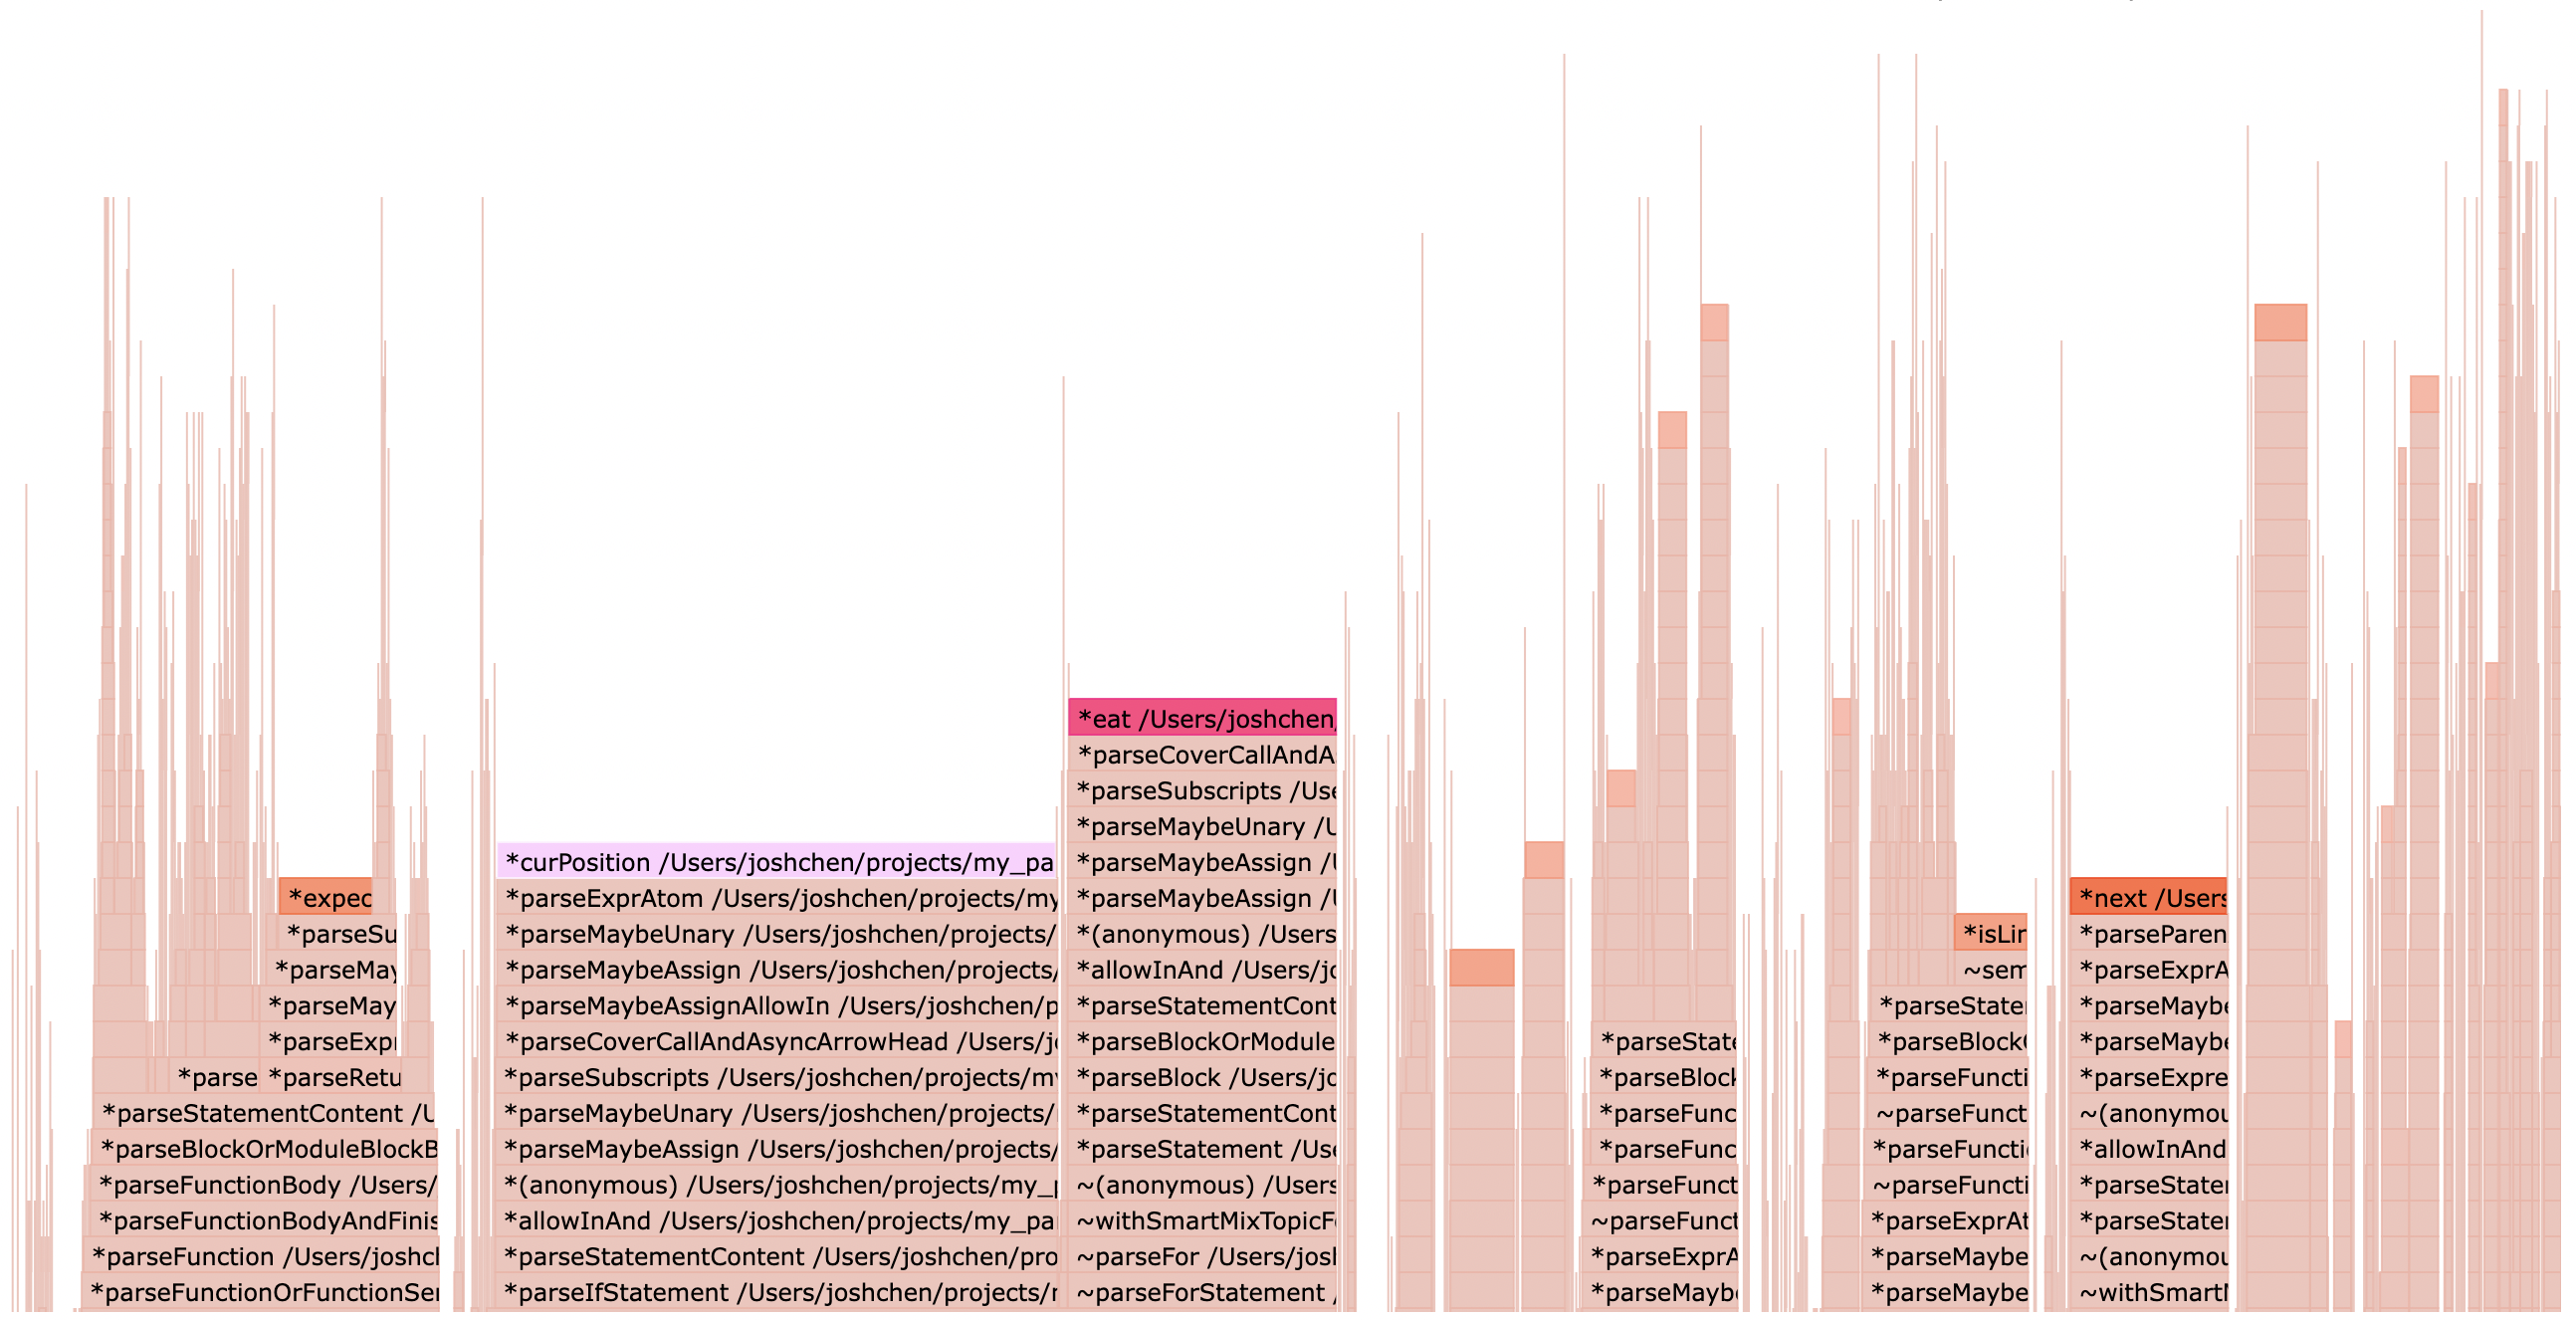
It’s immediately obvious curPosition is the single source of slowness. Its only job is to create a Position object that tells where the error happens. In a suggestion comment, a WeakMap is used to cache and expose ast node offset instead of a plain object property. To be fair it’s too much to ask to foresee the consequence since the performance hit of WeakMap only happens when the number of keys exceeds 2 millions.
Eventually the fix was made and was concluded with this claim:
There may exist some performance argument for switching over to .index as well, but from what I’ve seen so far it doesn’t seem to be too substantial.
The thread also tells us Prettier and one of the Netlify projects got this performance hit.
2 millions Keys
Of course the first thing I did was asking the internet, specifically the V8 dev discussions. The most relevant thread was again concluded with this statement:
The initially observed behavior seems to be fixed
No, it’s not.
Running the exact same test suggested by the OP gives you this graph
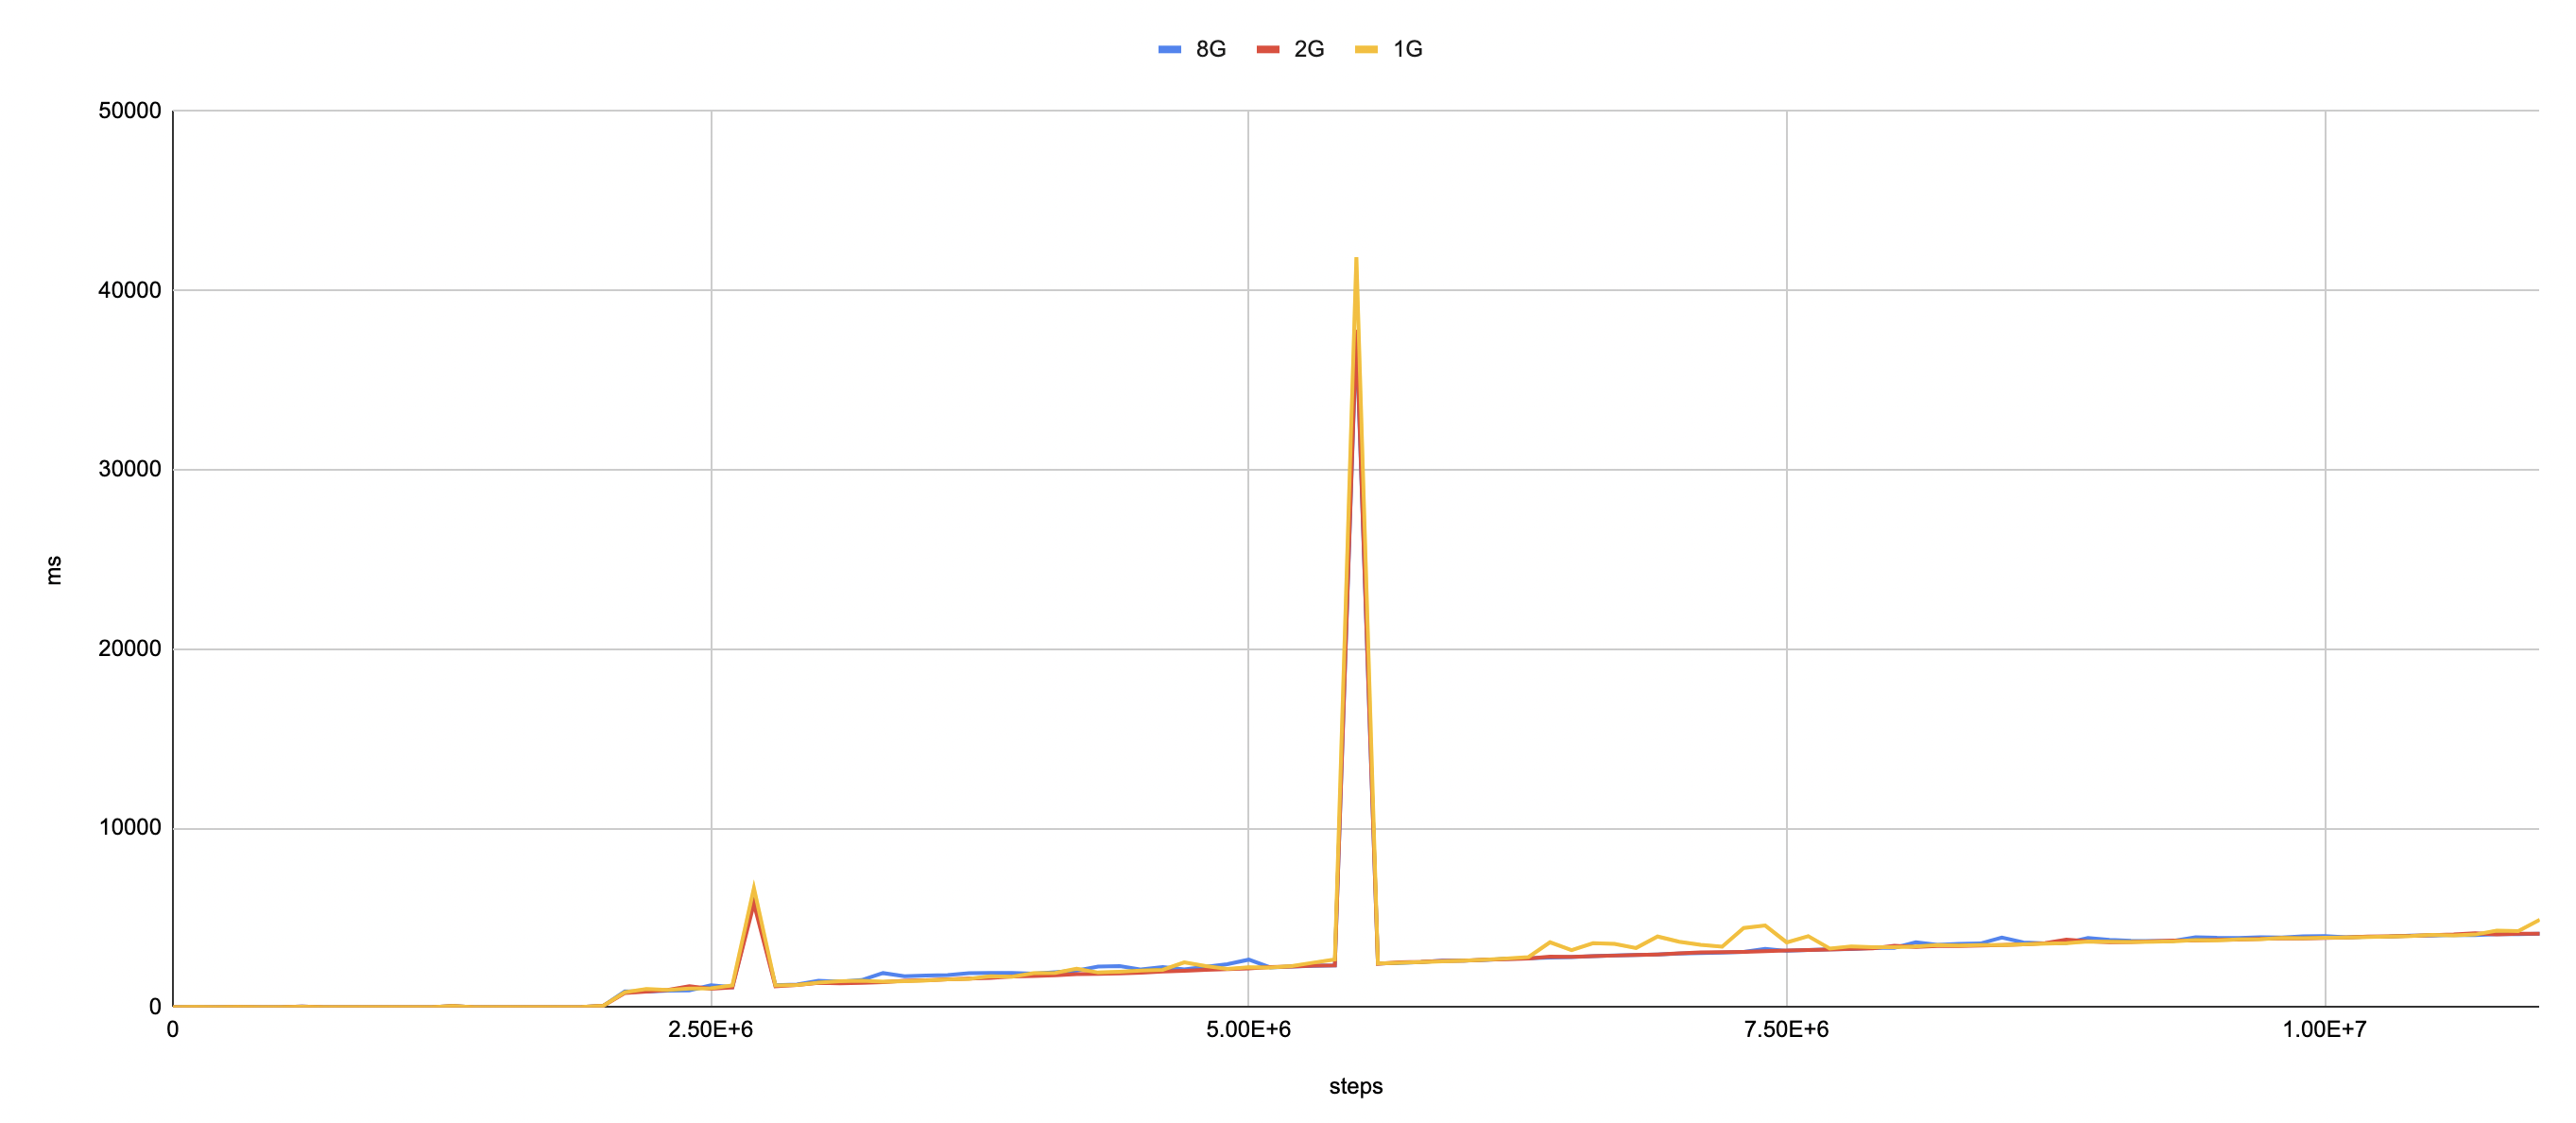
The set op gets 10 times slower at almost exactly 2 millions keys and gets even slower linearly after that, with spikes at 2.7 millions and 5.5 millions. Most surpisingly, the test stops at about 12 million and never finishs, no matter how much more memory is assigned.
Next
I would love to spend more time on digging into V8 and figure out why the spikes and halting.
On the other hand, the experience summarizes very well what have gone wrong about software dev. Assuming the spikes come from a compromise made in V8, it flows through the cracks of numerous tests and processes, all the way to ruin the physical world.